Doughnut charts
Before reading this documentation, it is recommended to read the general chart documentation first here.
This page will highlight the steps to follow to create Doughnut charts in PSHTML
Creating a simple Doughnut chart
A simple Doughnut chart, is nothing more then a Doughnutchart with a Dataset of type DatasetDoughnut
As a reminder, a dataset is what will allow to specify the looks of the graph. Things like the color, hover over color, thickness etc.. are all set via a dataset. Each chart type comes with a set of specific dataset properties (for example, how big should the emtpy space in a doughnut graph be - is an options that cannot apply to a line chart).
In order to create a Doughnutchart, we need to follow these steps: 0. Preparing a spot, for your chart, and linking to the library. 1. Create a datasetDoughnut 2. Create a chart 3. Add the dataset to the chart 4. Display the chart
In reality, step 1 & 2 and 3 & 4 are combined into comon steps represented in two different cmdlets .
Preparing a spot for your chart
A chart will find place on a canvas somewhere in your HTML page.
Add your canvas somewhere in your body section of your page, like this:
$DoughnutCanvasID = "Doughnutcanvas001"
canvas -Height 400px -Width 400px -Id $DoughnutCanvasID {

}
It is a good idea to set the id of the canvas in a variable, as it will be needed in a later step to indicate to the chart where it should be created.
Linking to the Chart Library
For the moment, one must add the following Script section at the end of the body section to ensure that the charting functionality can be used.
script -src "https://cdnjs.cloudflare.com/ajax/libs/Chart.js/2.7.3/Chart.min.js" -type "text/javascript"
Creating a dataset
The first step in creating a Chart is the creation of a Dataset.
Use the function New-PSHTMLChartDoughnutDataSet to save the dataset in a variable as in this example:
    $Data = @(34,7,11,19) #Get your data using any type of powershell cmdlet / function
    $dataset = New-PSHTMLChartDoughnutDataSet -Data $Data -label "March" -BackgroundColor ([Color]::Orange)
The
$Datavariable would contais integers, which would represents 'some' data over time for example.
Creating and assigning the chart
Once the data set is created, a chart needs to be created, and the dataset added to this latter one.
In order to create a chart in PSHTML use the following cmdlet:
New-PSHTMLChart
The
New-PSHTMLChartcmdlet is your only entry point needed in order create charts. For the Doughnut, set the -Type parameter value to Doughnut.
$Labels = @("Closed","Unresolved","Pending","Open") #description of each row from data
New-PSHTMLChart -Type Doughnut -DataSet $Dataset -Title "March Data" -Labels $Labels -CanvasID $DoughnutCanvasID
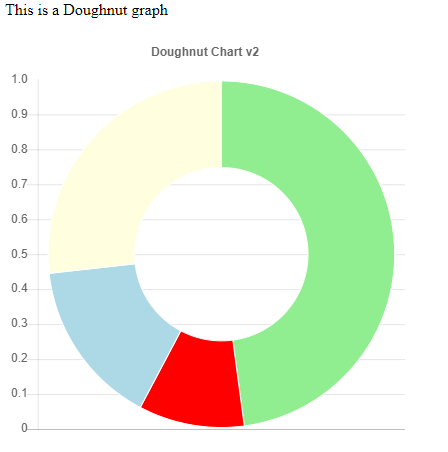
To recall, this was the data we provided:
$Data = @(34,7,11,19)
$Labels = @("Closed","Unresolved","Pending","Open")
Which represents data from a ticketing system:
| Closed | Unresolved | Pending | open |
|---|---|---|---|
| 34 | 7 | 11 | 19 |
This would result in the following graph:
Nota: The function must be called within a '-content' block of a 'script' section (See script listing below)
The full script listing is availble here under:
import-module PSHTML -force

$DoughnutCanvasID = "doughnutcanvas"
$HTMLPage = html {
    head {
        title 'Chart JS Demonstration'

    }
    body {

        h1 "PSHTML Chart"

        div {


            p {
                "This is a Doughnut graph"
            }
            canvas -Height 400px -Width 400px -Id $DoughnutCanvasID {

            }
       }

         script -src "https://cdnjs.cloudflare.com/ajax/libs/Chart.js/2.7.3/Chart.min.js" -type "text/javascript"


        script -content {

            $Data1 = @(34,7,11,19)


            $colors = @("LightGreen","Red","LightBlue","LightYellow")
            $dsd1 = New-PSHTMLChartDoughnutDataSet -Data $data1 -label "March" -backgroundcolor $colors -hoverbackgroundColor $Colors

            New-PSHTMLChart -type doughnut -DataSet @($dsd1) -title "Doughnut Chart v2" -Labels $Labels -CanvasID $DoughnutCanvasID


        }


    }
}


$OutPath = "$Home\BasicDoughnutChart.html"
$HTMLPage | out-file -FilePath $OutPath -Encoding utf8
start $outpath