PolarArea chart
Dataset
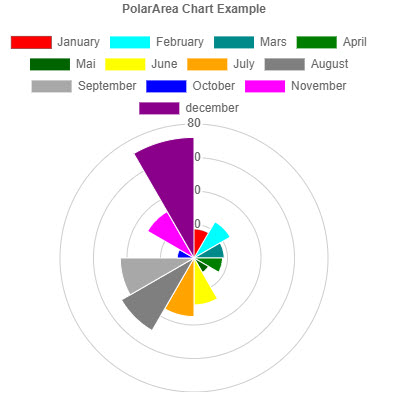
In the following example, we create a Polar Area chart dataset, with labels, specific colors, and the data of course.
$Labels      = @('January',   'February', 'Mars',     'April', 'Mai',       'June',   'July',    'August',      'September', 'October', 'November', 'december')
$Data1       = @(17,          25,         18,         17,      10,           28,      35,         50,           44,          10,        32,         72)
$Colors      = @('red',       'Cyan',     'DarkCyan', 'green', 'DarkGreen', 'yellow', 'Orange',  'grey',        'DarkGrey',  'blue',    'Magenta',  'DarkMagenta')
$HoverColors = @('DarkGreen', 'yellow',   'Orange',   'grey',  'DarkGrey',  'blue',   'Magenta', 'DarkMagenta', 'red',       'Cyan',    'DarkCyan', 'green' )


$dsb1 = New-PSHTMLChartPolarAreaDataSet -Data $data1 -BackgroundColor $Colors -hoverBackgroundColor $HoverColors
It is important to keep in mind, that the array of values which are past through each parameter going hand in hand together. For example, the data related to
January, represent17will beredand will turndarkgreenwhen we hover on it.Labelsare actually passed into the chart for PolarArea chart.
Creating a PolarArea chart
New-PSHTMLChart -type polarArea -DataSet $dsb1 -title 'PolarArea Chart Example' -Labels $Labels -CanvasID $AreaChart
Combining everything together
import-module PSHTML


$PolarCanvasID = "barcanvas"
$HTMLDocument = html {
    head {
        title 'Chart JS Demonstration'

    }
    body {

        h1 "PSHTML Graph"

        div {

            p {
                "This is a polarArea graph"
            }
            canvas -Height 400px -Width 400px -Id $BarCanvasID {

            }

        }

        script -src "https://cdnjs.cloudflare.com/ajax/libs/Chart.js/2.7.3/Chart.min.js" -type "text/javascript"

        script -content {

            $Labels      = @('January',   'February', 'Mars',     'April', 'Mai',       'June',   'July',    'August',      'September', 'October', 'November', 'december')
            $Colors      = @('red',       'Cyan',     'DarkCyan', 'green', 'DarkGreen', 'yellow', 'Orange',  'grey',        'DarkGrey',  'blue',    'Magenta',  'DarkMagenta')
            $HoverColors = @('DarkGreen', 'yellow',   'Orange',   'grey',  'DarkGrey',  'blue',   'Magenta', 'DarkMagenta', 'red',       'Cyan',    'DarkCyan', 'green' )
            $Data1       = @(17,          25,         18,         17,      10,           28,      35,         50,           44,          10,        32,         72)

            $dsb1 = New-PSHTMLChartPolarAreaDataSet -Data $data1 -BackgroundColor $Colors -hoverBackgroundColor $HoverColors

            New-PSHTMLChart -type polarArea -DataSet $dsb1 -title  'PolarArea Chart Example' -Labels $Labels -CanvasID $BarCanvasID
        }
    }
}


$OutPath = "$Home/PolarChart1.html"
Out-PSHtmlDocument -OutPath $OutPath -Show