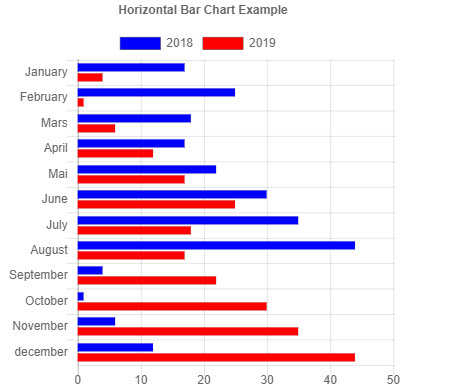
Horizontal bar chart
Since a Horizontal Bar Chart is nothing more than a Bar chart which is displayed horizontaly instead of vertically, everthing that applies to a regular bar chart, is applicable to a Horizontal bar chart.

Dataset
A dataset contains primary two things:
1- The data that needs to be displayed (an array of Integers)
2- Information that will allow the dataset to be differentiated
$Data1 = @(17,25,18,17,22,30,35,44,4,1,6,12)

$dsb1 += New-PSHTMLChartBarDataSet -Data $data1 -label "2018" -BackgroundColor (get-pshtmlColor -color blue) -hoverBackgroundColor (get-pshtmlColor -color green)
options
Creating a chart
To create a horizontal bar chart, use New-PSHTMLChart -type HorizontalBar. See the example below.
New-PSHTMLChart -type horizontalBar -DataSet $Dataset -title "Horizontal Bar Chart Example" -Labels $Labels -CanvasID $BarCanvasID
Example
$BarCanvasID = "HorizontalBarcanvas"
$HTMLPage = html {
    head {
        title 'Chart JS Demonstration'

    }
    body {

        h1 "PSHTML Graph"

        div {

            p {
                "This is a horizontal bar graph"
            }
            canvas -Height 400px -Width 400px -Id $BarCanvasID {

            }

        }

        script -src "https://cdnjs.cloudflare.com/ajax/libs/Chart.js/2.7.3/Chart.min.js" -type "text/javascript"

        script -content {

            $Labels = @("January","February","Mars","April","Mai","June","July","August","September","October","November","december")
            $dsb1 = @()

            $Data1 = @(17,25,18,17,22,30,35,44,4,1,6,12)

            $dsb1 += New-PSHTMLChartBarDataSet -Data $data1 -label "2018" -BackgroundColor (get-pshtmlColor -color blue) -hoverBackgroundColor (get-pshtmlColor -color green)
            $Data2 = @(4,1,6,12,17,25,18,17,22,30,35,44)
            $dsb1 += New-PSHTMLChartBarDataSet -Data $data2 -label "2019" -BackgroundColor (get-pshtmlColor -color red) -hoverBackgroundColor (get-pshtmlColor -color yellow)

            New-PSHTMLChart -type horizontalBar -DataSet $dsb1 -title "Horizontal Bar Chart Example" -Labels $Labels -CanvasID $BarCanvasID

        }


    }
}


$OutPath = "$Home/BarChart1.html"
Out-PSHTMLDocument -HTMLDocument -OutPath $outpath -Show