Working with colors in PSHTML
When it comes to styling a html page, one can rarely do it without applying colors. Charts colors are also highly customizable (hover color, backgroundcolor etc..)
In a HTML document, colors can be defined in different formats: Hexidecimal, HSL,HSLA,RGB,RGBA
each of them has it's own specificity. (Transparency, easy format etc..)
In version 0.8.0 of PSHTML we introduced a new function called Get-PSHTMLColor. This function allows to have an abstraction layer on the color model, and allows one to use simple color names to get the 'complex' color schemes back.
It allow one to simply tab throw the different colors available (on the -color Parameter), and select the appropriate color by name.
The 140 official HTML color names and values are available through
Get-PSHTMLColor
Each time you need to apply some color somewhere in your HTML document, you can use the -Color parameter from the Get-PSHTMLColor simplify that process.
If not type parameter is specified, the
get-pshtmlcolorwill default torgb
Example
Let's say you want to style something with the Aliceblue color
Get-PSHTMLColor -Type hex -Color aliceblue
#F0F8FF
Now, if you prefere to have the color in a RGB format, then you simply have to call Get-pshtmlColor like this
Get-PSHTMLColor -Type rgb -Color aliceblue
# returns
rgb(240,248,255)
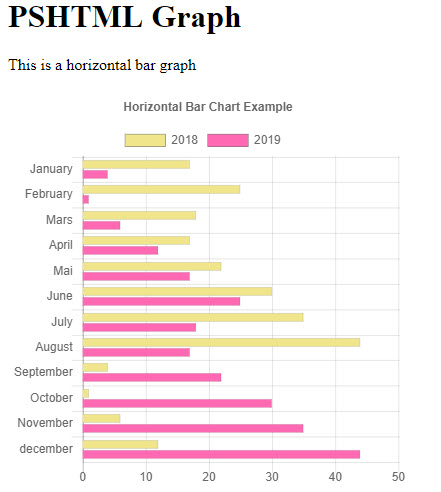
Applying a color to a chart
Charts can have colors applied to different parts of the chart: Backgroundcolor and HoverBackgroundColor are good examples.
The colors below are reference as
chartcolors, but are in reality colors applied to thedatasetof the charts.
$dsb1 += New-PSHTMLChartBarDataSet -Data $data1 -label "2018" -BackgroundColor (get-pshtmlColor -color Khaki) -hoverBackgroundColor (get-pshtmlColor -color Salmon)
$Data2 = @(4,1,6,12,17,25,18,17,22,30,35,44)
$dsb1 += New-PSHTMLChartBarDataSet -Data $data2 -label "2019" -BackgroundColor (get-pshtmlColor -color HotPink) -hoverBackgroundColor (get-pshtmlColor -color LightPink)

New-PSHTMLChart -type horizontalBar -DataSet $dsb1 -title "Horizontal Bar Chart Example" -Labels $Labels -CanvasID $BarCanvasID
Running the above code, will return the following result:
The full code extract of the example is available here
import-module PSHTML
$BarCanvasID = "barcanvas"
$htmlDocument = html {
    head {
        title 'Chart JS Demonstration'

    }
    body {

        h1 "PSHTML Graph"

        div {

            p {
                "This is a horizontal bar graph"
            }
            canvas -Height 400px -Width 400px -Id $BarCanvasID {

            }

        }

        script -src "https://cdnjs.cloudflare.com/ajax/libs/Chart.js/2.7.3/Chart.min.js" -type "text/javascript"

        script -content {

            $Labels = @("January","February","Mars","April","Mai","June","July","August","September","October","November","december")
            $dsb1 = @()

            $Data1 = @(17,25,18,17,22,30,35,44,4,1,6,12)

    $dsb1 += New-PSHTMLChartBarDataSet -Data $data1 -label "2018" -BackgroundColor (get-pshtmlColor -color Khaki) -hoverBackgroundColor (get-pshtmlColor -color Salmon)
    $Data2 = @(4,1,6,12,17,25,18,17,22,30,35,44)
    $dsb1 += New-PSHTMLChartBarDataSet -Data $data2 -label "2019" -BackgroundColor (get-pshtmlColor -color HotPink) -hoverBackgroundColor (get-pshtmlColor -color LightPink)

    New-PSHTMLChart -type horizontalBar -DataSet $dsb1 -title "Horizontal Bar Chart Example" -Labels $Labels -CanvasID $BarCanvasID

        }


    }
}


$OutPath = "$Home/BarChart2.html"
Out-PSHTMLDocument -HTMLDocument $htmlDocument -OutPath $outpath -Show